Category: VOD

  • What do we Love ❤️ to Watch on Netflix?

    What do we Love ❤️ to Watch on Netflix?

    In an effort to boost transparency, Netflix have been releasing their bi-annual ‘What We Watched’ reports, which is lovely. The problem is their data is presented in a rather unwieldy 7000 line excel sheet it’s pretty hard to navigate. So I thought I’d help out…

    You can access my enhanced report here: www.mattrennie.com/netflix

    With a bit of spare time free last week, I compiled the 3 reports currently available (1, 2, 3) and then added some custom processing to enhance them. I ran a cleaning script to aggregate data up to Series level (rather than Season), and then aligned Series up to the open source TheTVDB.com database, leveraging a Python script to start to pull and match data from their API to embellish the data with additional info such as genres.

    Bridgerton season 3, Netflix's top performing season & series
    Bridgerton s3, Netflix’s top performing season and series

    I have focused on Hours Viewed as the key metric, largely dropping their Views data with it’s unconventional calculation — dividing the Hours Viewed by the total Runtime of the content in question. Many platforms have their own interpretation of views (min 2″ viewed / 30″ viewed etc..) but this is a new one on me! The result only restates the Hours Viewed as a function of Runtime and isn’t much use in understanding consumer behaviour on the platform. Interestingly, it also tends to downplay the importance of large catalog series to the platform which you can see comparing the Series Performance tab to the Season Performance tab.

    Netflix Data

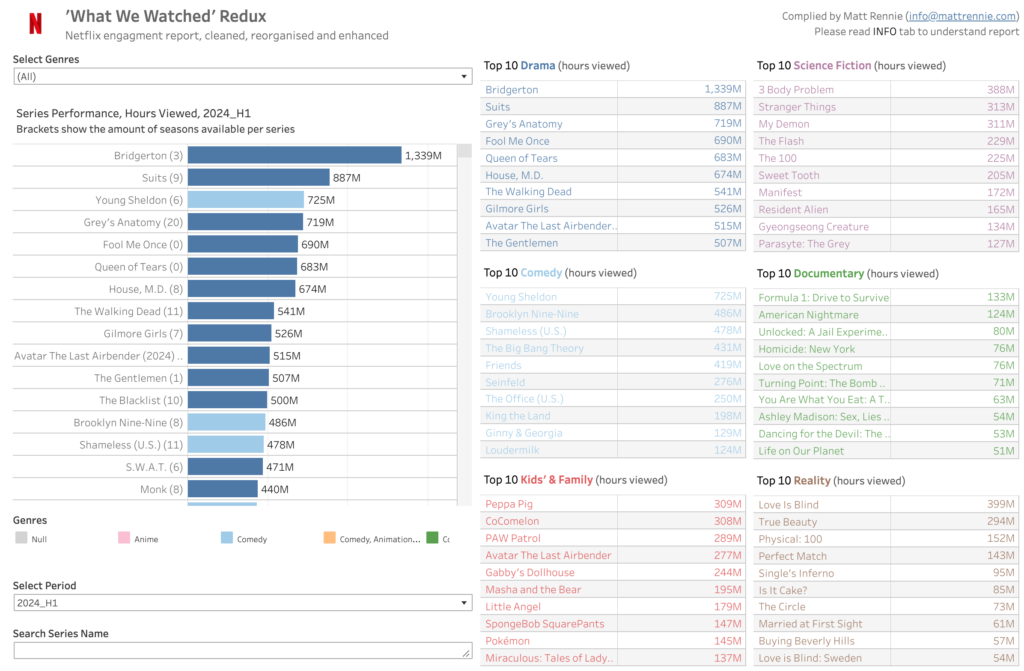
    For now, I focused on TV Series, as they account for around 70% of all viewing. I also haven’t yet finished cleaning all of the Series data but the biggest ones that cover over 80% of all TV viewing are covered. I’ll continue working through the rest of the Series and Movies over the coming weeks.

    It’s also worth noting that whilst most of the cleaning has been automated, some manual work was still necessary. I relied on TheTVDB.com, which is open source and may contain some inaccuracies. IMDB was an alternative but it’s terribly expensive. If you spot any errors or have suggestions for additional views or insights, feel free to drop me an email (info@mattrennie.com). Now I’ve laid the groundwork, updates will be relatively easy for new views or incorporating data such as from their next bi-annual report.

    Oh, and Netflix… you’re welcome 😉

  • Do VOD Services Really Satisfy Audiences? According To Ofcom…

    Do VOD Services Really Satisfy Audiences? According To Ofcom…

    I built this chart by combining VOD (video on demand) data available in Ofcom‘s Media Nations and filling in the blanks from the underlying data.

    It’s an interesting comparison, despite the B or S (BS??) variance in VOD type. Though it’s odd to me to have excluded YouTube which also sat in the same dataset.


    A couple of thoughts..

    • This multiple app route is going to start creating issues as users get tired of switching apps and using various machinations of recommendations and search funcitons to find something to watch,
    • I’ve now settled on two or three services which i’ll browse for and generally find something that i’m happy to watch,
    • Without a common discovery UI (like the EPG) this will start creating challenges for new entrants to make a successful entry and then grow,
    • Freely is clearly a potential answer here depending on how and how far it rolls out. It does make me think of what a short-sighted decision it was to kill Kangaroo all that time ago!
    • You can see why YouTube is posing such a threat to TV attention with high satisfaction scores across product and content metrics. Whether it’s ‘broadcast quality’ content or not, audiences are clearly satisfied with it and score it particularly highly for programmes that are relevant to me and featuring people like me.
    Ofcom analysis of satisfaction of Video On Demand (VOD) services
  • Damn! Did I miss the Fireworks? 🎆

    Damn! Did I miss the Fireworks? 🎆

    Lot’s of interesting tit bits from Ofcom‘s excellent Media Nations report #youngpeoplewatchinglessliveTVshock.

    But for me, one outstanding stat was that 8% of the 12.1m people (yes that’s nearly a million people!) watching the New Year’s fireworks are doing so 1-7 days after New Years Eve! Call me a party pooper 🎉 but I struggle to watch fireworks live in person, let alone on telly and absolutely not as catch up! #mindblown 🎇

    Ofcom's top live / catch-up performers
  • YouTube Advertising Marches Impressively On..

    YouTube Advertising Marches Impressively On..

    Not much evidence of any sluggishness in YouTube Advertising numbers reported this week..

    ..with a forth sequential quarter of double digit growth – – at this rate they’re on target for their first 10Bn quarter by the end of the year.

    YouTube Advertising Revenues by quarter

    Note: these numbers don’t include YouTube premium which in my experience is somewhere between 10% and 20% of total revenues, which would peg it in the 1Bn to 2Bn range (it’s reported separately alongside other sub (e.g. Music) device and platform revenue).

    YouTube are still circumspect on the revenue contribution from Shorts, usage yes but its impact as a direct revenue driver is yet to be seen. CTV still super important and growing (30% YoY).

    At the risk of stating the obvious, for any premium streamer or broadcaster, this is your #1 competitor! And anyone who continues to use the term ‘broadcast quality’ in the context of being a competitive advantage, from now on i’m just going to assume that you’re struggling to monetise it 😬