In an effort to boost transparency, Netflix have been releasing their bi-annual ‘What We Watched’ reports, which is lovely. The problem is their data is presented in a rather unwieldy 7000 line excel sheet it’s pretty hard to navigate. So I thought I’d help out…
With a bit of spare time free last week, I compiled the 3 reports currently available (1, 2, 3) and then added some custom processing to enhance them. I ran a cleaning script to aggregate data up to Series level (rather than Season), and then aligned Series up to the open source TheTVDB.com database, leveraging a Python script to start to pull and match data from their API to embellish the data with additional info such as genres.
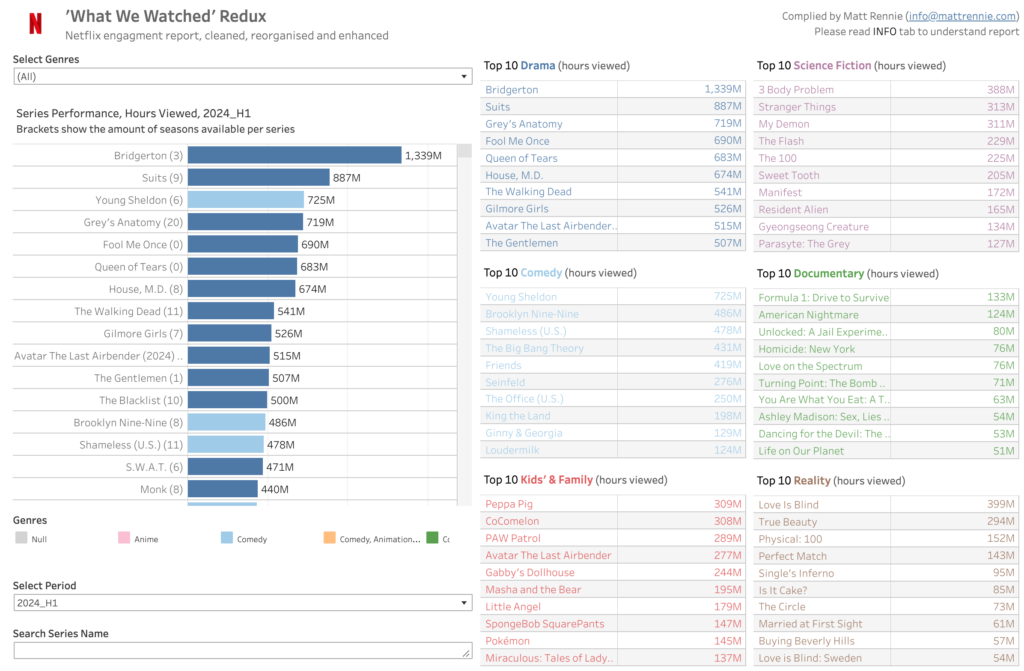
Bridgerton s3, Netflix’s top performing season and series
I have focused on Hours Viewed as the key metric, largely dropping their Views data with it’s unconventional calculation — dividing the Hours Viewed by the total Runtime of the content in question. Many platforms have their own interpretation of views (min 2″ viewed / 30″ viewed etc..) but this is a new one on me! The result only restates the Hours Viewed as a function of Runtime and isn’t much use in understanding consumer behaviour on the platform. Interestingly, it also tends to downplay the importance of large catalog series to the platform which you can see comparing the Series Performance tab to the Season Performance tab.
For now, I focused on TV Series, as they account for around 70% of all viewing. I also haven’t yet finished cleaning all of the Series data but the biggest ones that cover over 80% of all TV viewing are covered. I’ll continue working through the rest of the Series and Movies over the coming weeks.
It’s also worth noting that whilst most of the cleaning has been automated, some manual work was still necessary. I relied on TheTVDB.com, which is open source and may contain some inaccuracies. IMDB was an alternative but it’s terribly expensive. If you spot any errors or have suggestions for additional views or insights, feel free to drop me an email (info@mattrennie.com). Now I’ve laid the groundwork, updates will be relatively easy for new views or incorporating data such as from their next bi-annual report.
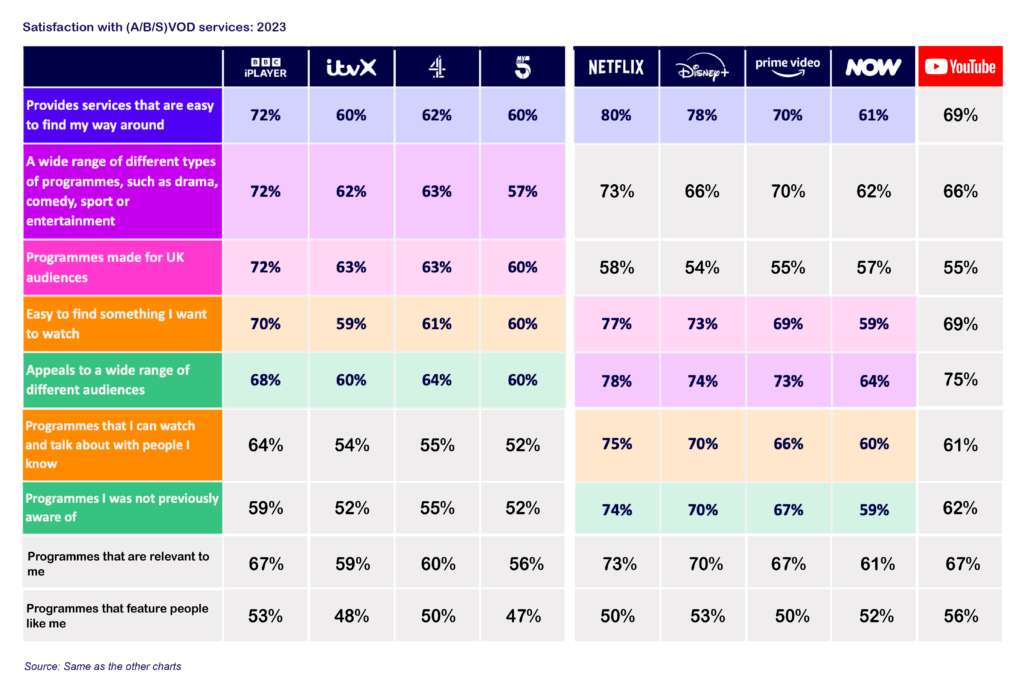
I built this chart by combining VOD (video on demand) data available in Ofcom‘s Media Nations and filling in the blanks from the underlying data.
It’s an interesting comparison, despite the B or S (BS??) variance in VOD type. Though it’s odd to me to have excluded YouTube which also sat in the same dataset.
A couple of thoughts..
This multiple app route is going to start creating issues as users get tired of switching apps and using various machinations of recommendations and search funcitons to find something to watch,
I’ve now settled on two or three services which i’ll browse for and generally find something that i’m happy to watch,
Without a common discovery UI (like the EPG) this will start creating challenges for new entrants to make a successful entry and then grow,
Freely is clearly a potential answer here depending on how and how far it rolls out. It does make me think of what a short-sighted decision it was to kill Kangaroo all that time ago!
You can see why YouTube is posing such a threat to TV attention with high satisfaction scores across product and content metrics. Whether it’s ‘broadcast quality’ content or not, audiences are clearly satisfied with it and score it particularly highly for programmes that are relevant to me and featuring people like me.
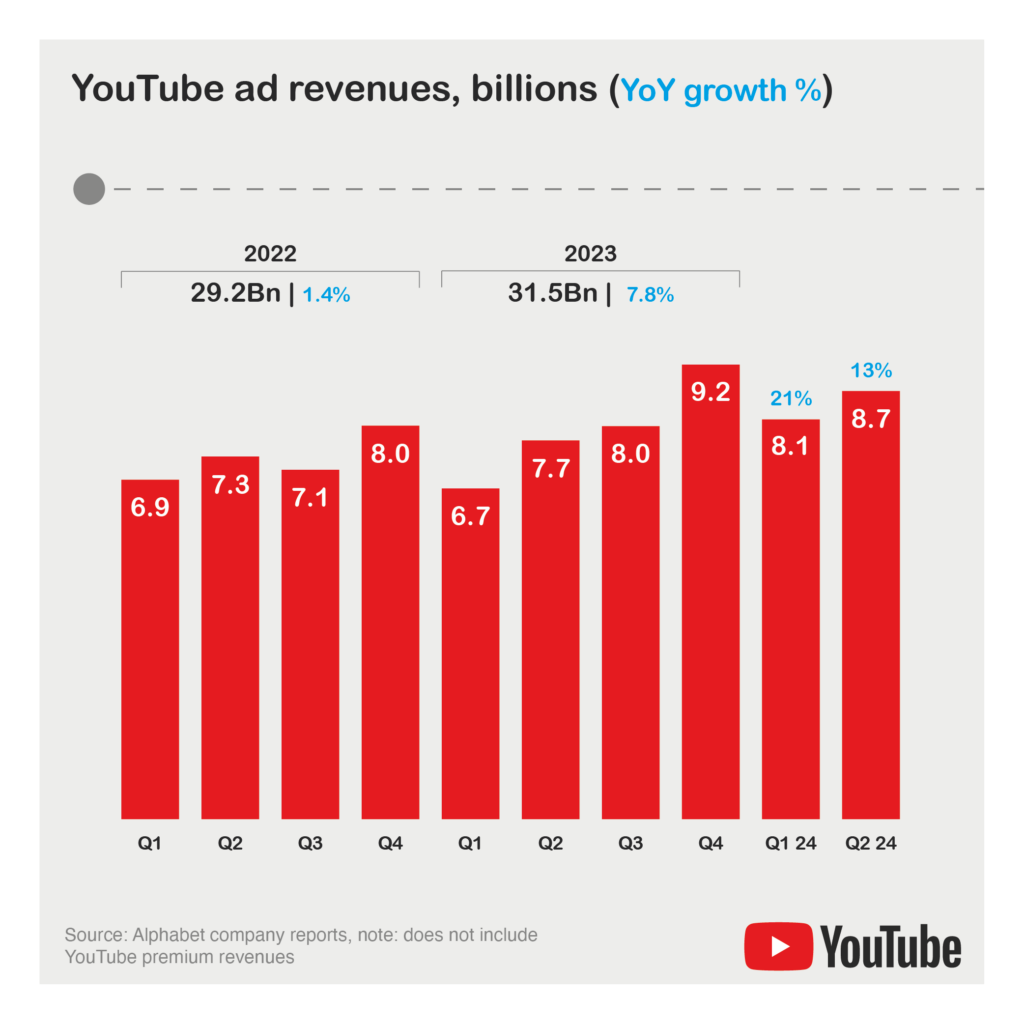
Not much evidence of any sluggishness in YouTube Advertising numbers reported this week..
..with a forth sequential quarter of double digit growth – – at this rate they’re on target for their first 10Bn quarter by the end of the year.
Note: these numbers don’t include YouTube premium which in my experience is somewhere between 10% and 20% of total revenues, which would peg it in the 1Bn to 2Bn range (it’s reported separately alongside other sub (e.g. Music) device and platform revenue).
YouTube are still circumspect on the revenue contribution from Shorts, usage yes but its impact as a direct revenue driver is yet to be seen. CTV still super important and growing (30% YoY).
At the risk of stating the obvious, for any premium streamer or broadcaster, this is your #1 competitor! And anyone who continues to use the term ‘broadcast quality’ in the context of being a competitive advantage, from now on i’m just going to assume that you’re struggling to monetise it 😬
Last week when looking at ITV’s annual report I suggested that News could be an opportunity for them based on what I perceived to be a relatively insular (ITVX focussed) strategy..
It got me thinking about how much of a greenfield opportunity Digital News is on new digital and social platforms. So I’ve spent the last week or so looking at the various iterations of legacy news operations and how they’ve been applied on these platforms. This all in advance of Ofcom‘s new News Consumption Survey which is due next month (May).
Some headlines…
As it stands, The Daily Mail has the most effective overall social digital media strategy, although it feels quite disjointed and leads to a confusing brand picture.
I find BBC News’s performance particularly lacklustre given their position as the UK’s number 1 media brand and the global influence they aspire to exert.
The philosophical approach by our PSBs and some legacy media risks ceding control of the social news agenda to new entrants (GB News) whilst it’s importance continues to grow.
There’s a significant upside opportunity for mainstream news brands to engage an already huge and growing audience.
YouTube
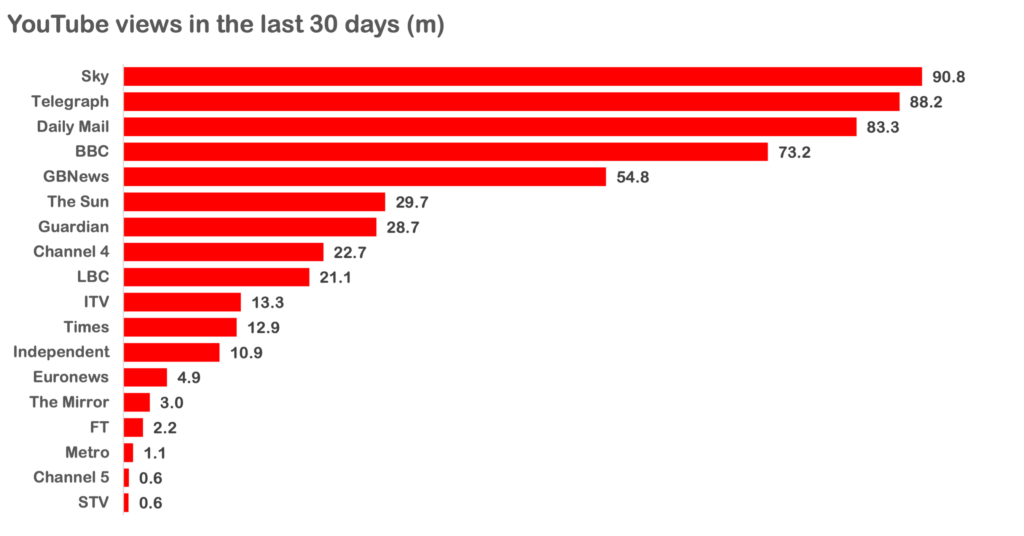
YouTube views, last 30 days, courtesy of Social Blade
On YouTube, brands tended to follow one of two paths. Of the top performers, Sky News, BBC News and GB News employ an approach faithful to their overall editorial. Whereas the Telegraph’s and Daily Mail’s YouTube channels seem to bear little resemblance to any cohesive editorial strategy. That’s not to say they’re not engaging, but I struggle to see how generic syndicated news clips deliver any real value to their brand.
Sky was most impactful, delivering a high volume of content, including live-streams of their linear output, although I still feel there’s a HUGE opportunity in creating bespoke platform specific content tailored for this audience rather than simply clipping traditional linear output. We always found there was huge upside in leveraging the intelligence from usage data to optimise content with the specific platforms and audiences in mind. The BBC has some nice bespoke content on their ‘Shorts’ page but generally just post clipped content from their linear feed.
Overall, I found GB News’ approach to be the most adapted to the platform with a specific thumbnail strategy, some bespoke content, super high volume and use of live and a extremely faithful editorial output (if somewhat predictable and click-baity).
I guess YouTube uses red too?
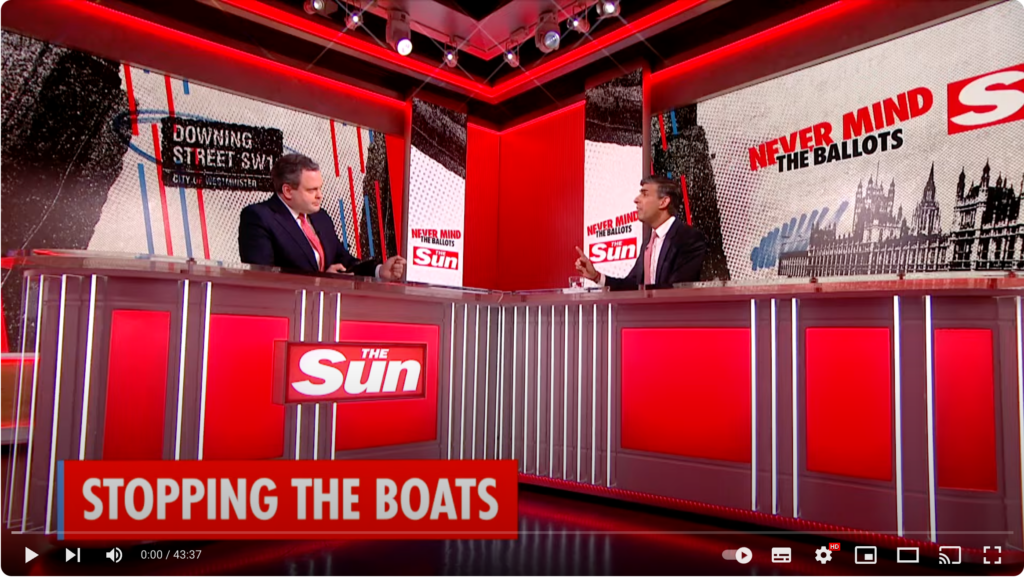
The Sun has built some bespoke content although rather than lean into audience and platform specific trends, they’ve taken a very traditional / formal ‘suits behind a desk’ approach presenting an audio visual case study of why you shouldn’t allow marketing or brand people to design sets.
Overall I find the YouTube numbers underwhelming. Despite the BBC being one of the best known English language news services in the world and allegedly being the most visited English language website, it’s only 197th in Social Blades list of YouTube’s impactful news channels (only 6 of the legacy UK services I reviewed appear at all in the top 500!). With the amount of content and resources at their disposal the BBC should be aiming north of 500m monthly views and could probably get closer to 1Bn.
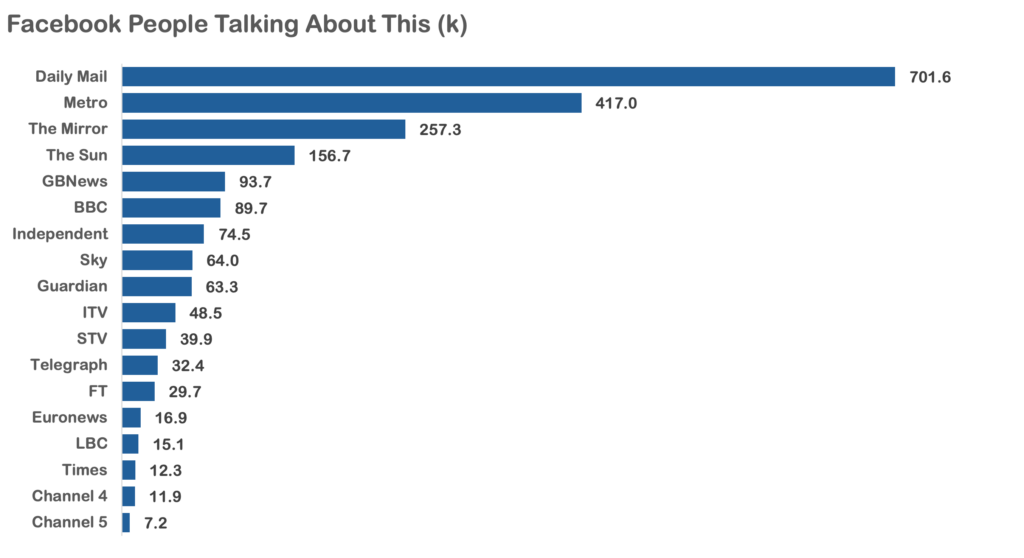
Facebook
Facebook, People Talking About This, courtesy of Social Blade
On Facebook I used their ‘People Talking About This’ stat as a comparative measure of currency and impact. Almost exclusively, News brands are using Facebook as a discussion board and link farm to drive people back to their owned websites and apps.
The Daily Mail are stand out leaders with a strategy of ridiculously high post volume (close to 10 every hour). Unlike their YouTube, it’s really faithful to their core digital editorial output and given the tabloid nature of the content, seems to generate a fair amount of discussion amongst the Facebook-crowd. Perhaps unsurprisingly, other tabloid titles dominate the top performers with all employing a slightly less effective version of the Mail’s strategy.
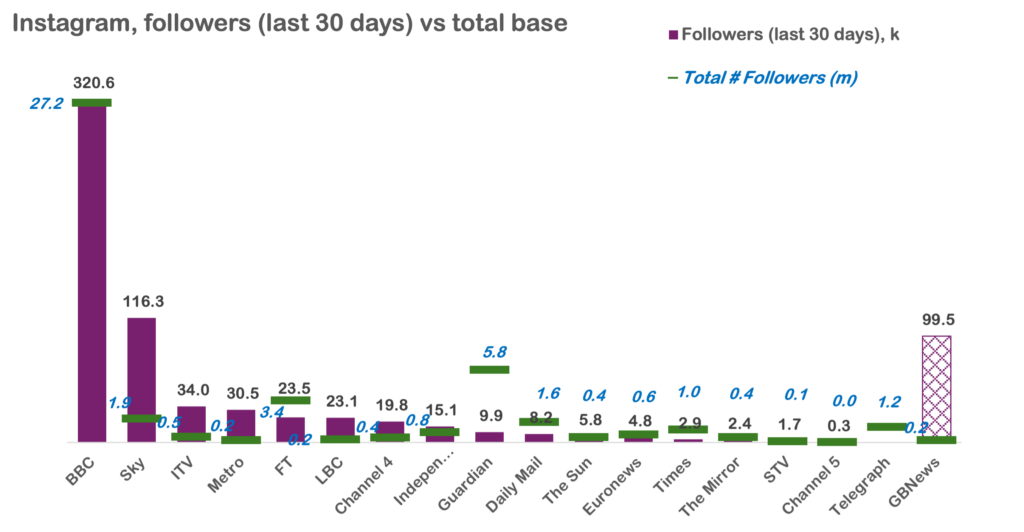
Instagram
Insta followers, last 30 days and total, courtesy of Social Blade
I personally struggle to recognise Instagram’s suitability as a viable news platform, but it’s mass media scale dictates audiences will consume it there regardless. The stats are difficult to interpret and the strategies quite unique. My analysis was centered around the main pages for legacy brands although brands (e.g. BBC News) often employ tens of different Insta accounts, a varying mix of images and reels, some video focused, whilst others clearly using picture editors to focus on image quality. I’ve considered multiple benchmarks.
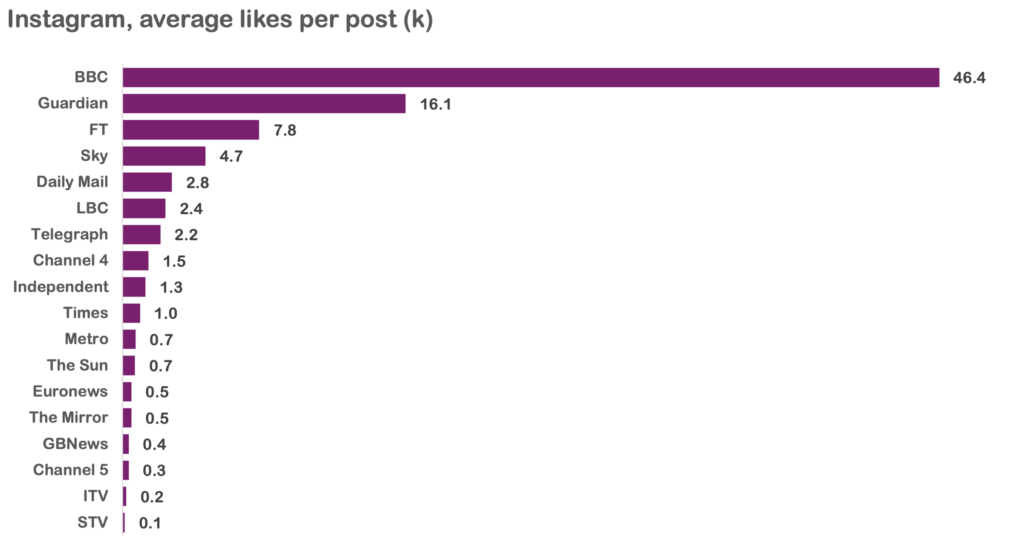
Instagram average likes per post, courtesy of Social Blade
BBC News is the stand out leader with a massive 27m followers, 320k incremental followers within the last 30 days and 46.4k avg. likes per post. The Guardian and FT have impactful strategies leaning into the aesthetical nature of the platform. They have large follower numbers (5.8m & 3.4m) and are gaining large amounts of likes per post (16.1k and 7.8k) but they’re not posting very much (maybe once a day) and so any follower movement in the last 30 days is muted. Sky have a mixed picture editor / video strategy, are quite active in posting and generating significant engagement (likes per post) evident not only large in total follower numbers (1.9m) but also in terms of last 30 day movement (116k). GB News’ data is broken (via Social Blade) for the last 30 days and massively overstates their recent impact, they have 193k followers who aren’t particularly engaged (400 likes per post). Whilst extremely active, they’re basically using it as a video distribution platform.
I quite like what ITV and the Metro are doing. ITV has bespoke content (via Reels), although I’d like to see them fully adapt and replace the clipped linear content on the main feed. Metro have also developed quite a nice style leaning into platform functionality to mix the use of images, text and video quite effectively. Both strategies seem to be working with decent follower movement in the last 30 days.
TikTok
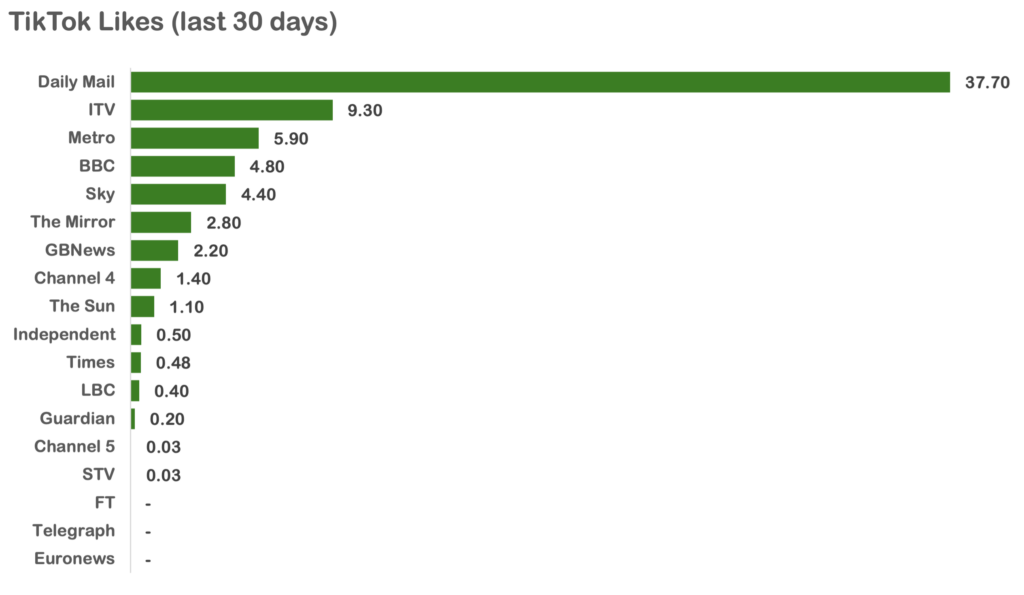
TikTok, likes in the last 30 days, courtesy of Social Blade
The Daily Mail has the largest and most engaged base on TikTok, but again has a unique editorial for this individual platform (this time a US-centric celebrity gossip focus). I’m sure there must be logic in their overarching strategy (they won’t cannibalise each other?) but it doesn’t feel additive to a consistent brand message from where I’m sat. You can’t deny they’ve achieved success and scale, although I note their digital revenues seemed to have flatlined last year and it will be interesting to see how they react to this. ITV are posting some of the bespoke content seen on their Insta, but again I’d like to see them take a wholly bespoke approach, engaging the audiences they’ve started to build. Metro are also making bespoke content but have a much lighter posting schedule, delivering the same impact (in likes) with only 10% – 20% (2/3 post per day) of the content output of the Mail, ITV, Sky or the BBC. BBC and Sky are still largely just clipping linear content albeit with some light post-production customisation and would do well to experiment with more bespoke content.
Owned platforms vs Social Media
Many of the PSBs and legacy news brands opt to favour their own platforms as a focus for their digital efforts based on an ability to own the data and/or monetise them more effectively (and not share any of that revenue). Whilst I can understand that, I don’t believe the PSBs do news entirely for commercial reasons and certainly I find the BBC’s philosophical approach here slightly odd given they don’t have the same commercial restrictions. All that said, I don’t believe social content particularly cannibalises other consumption and so would recommend a more active and innovative strategy to engage this growing audience. In fact, when you have a cohort of the population growing up away from traditional media channels, active social content strategies could be an important route to seed and build relationships between consumers and legacy brands that blossom into deeper direct consumption relationships further down the road.
Methodology
I looked at various legacy broadcast and publishing news services across YouTube, Facebook, Instagram and TikTok using Social Blade for my analysis trying to get reasonable metrics to assess currency and engagement. I pulled the data on the 3rd and 4th of April and so depending on lag of data feeds by platform the 30 day periods reviewed were consistent for comparative purposes and generally had most of March and possibly a few days of February. I reviewed The Independent, The Guardian, The Telegraph, Financial Times, Daily Mail, The Times, The Sun, BBC News, Channel 4 News, Channel 5 News, ITV News, Sky News, STV Group plc News, Euronews , Daily Mirror, Metro.co.uk, Global‘s LBC and GB News. To be clear, I’ve just been looking at the presentation of these services, not passing judgement on the status or quality of their journalism, nor have I tried to take a position on the bias of their output. I now need to go and purge my browsing history so I can get back to being fed golf clips rather than the various iterations of news the algorithms now think I’m interested in!